

After several months of organizing, marketing, and executing, the event has ended. The booths are taken down, the lights are off, and the audience is gone. For many teams, this is when the reporting starts, exporting registration lists, counting survey responses, taking screenshots of social media impressions.
But therein lies the issue: too much data, too little insight.
Executives do not want a 40-slide deck of vanity metrics like, “1,000 likes on LinkedIn” or “3,000 emails sent.” They want an answer to a different question: “Did this event have business impact?”
This is where choosing the right metrics is important because event teams should be looking at 15 metrics that cheat to move the dial, representing quantitative, qualitative and strategic measures capturing a holistic story.
This blog highlights the top 15 post-event metrics every organization should identify and follow in their reports. Think of this as your measure: if you report on only these, you will be able to measure audience reach, engagement, satisfaction, ROI and longer-term impact on the business.
Attendance & Reach Metrics
Let’s start here. Attendance, and reach metrics provide a degree of confidence that the promotional efforts were used effectively to attract the right audience, and how much top of funnel interest the event generated.
1. Registrations
The number of individuals registered for the event. While it appears to be a basic metric, it does add context for the effectiveness of your promotions. Did your email marketing, ads and organic marketing get enough interest? Registrations provide that first answer.
2. Attendance Rate
How many of the registrants showed up? A strong attendance rate indicates your audience engaged in a value-added experience, whereas a low attendance rate could imply a problem with timing, relevance, or the registration-to-attendance process.
3. No-Show Rate
Every marketer has seen it: large registration numbers, but dismal turnout. Monitoring no-shows shows whether you are really getting the right people or just inflating lists with unqualified leads. It also acts as a compass for future improvements related to reminders, incentives, or scheduling.
All three metrics work together. They provide an anchor – did we grab attention and convert interest to attendance?
Engagement Metrics
Once people show up, the next question is, “did they engage?” Passive attendance is no longer sufficient, especially when it comes to enterprise events; interaction shows a greater level of interest.
4. Session Attendance
What sessions had the largest audiences? Tracking attendance by session helps capture hot topics, strong speakers, and content themes that resonate.
5. Poll Responses
Polls administered in real-time or interactive surveys will show not only attendance, but engagement. Lots of poll responses suggest a high level of energy and buy-in; low poll responses may be an indicator of disengagement or poorly timed interaction.
6. Q&A Activity
How many questions were asked in the sessions? Did they scratch the surface or were they deep and detailed? Q&A activity is usually a proxy for relevance. If attendees are leaning forward, asking questions, and demanding further clarity, you likely hit the mark.
The three metrics working together show: Were attendees leaning in or just sitting back?
Conversion Metrics
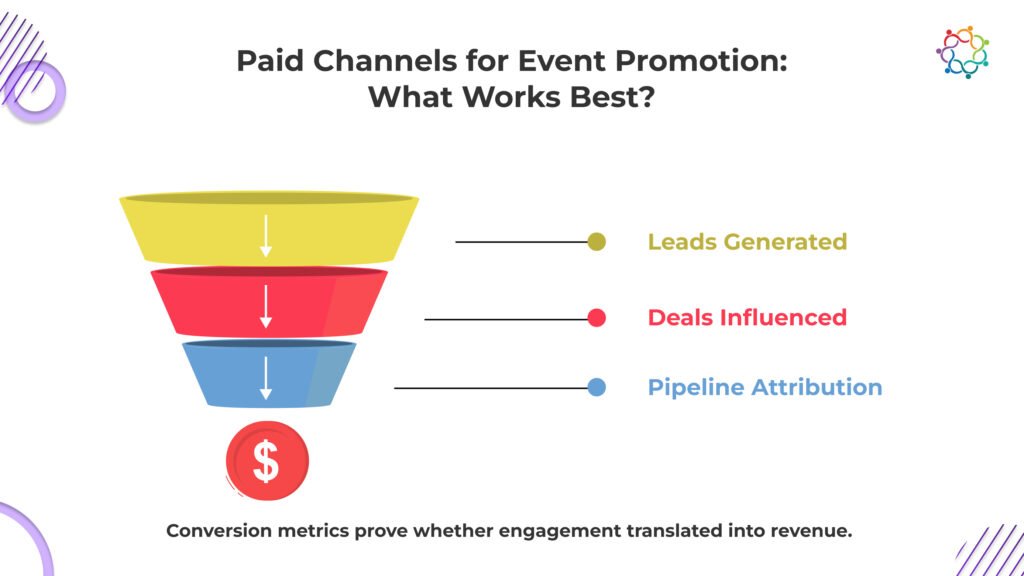
Here we change the conversation from participation to business outcomes. For companies, conversion metrics are the strongest evidence that events are not simply cost losses for branding, they are truly growth engines.
7. Leads Generated
Aside from registrations, how many qualified leads did your event create? This includes booth scans, networking matches, and gated content downloads. The magic word here is qualified, raw contacts are not leads.
8. Deals Influenced
Now, going a level deeper: Which deals already in your CRM were influenced by the event? Did attendees attend sessions, meet with sales teams, or meet sponsors? Influenced deals show how your event contributed to the pipeline.
9. Pipeline Attribution
Possibly the most boardroom-friendly metric: What’s the monetary value of the opportunities that were linked directly to your event? We typically call this the pipeline attribution matrix, and this is the one that we can tie directly back to revenue.
With these three-conversion metrics, you’re answering the most important question that the CEO will want to know: “How did the event contribute to the company’s revenue growth?”

Want to see how this would work for you?
See your 15 metrics in one dashboard
30 minutes inside Samaaro analytics, configured around the metrics your team reports on.
Book a tailored walkthroughSatisfaction Metrics
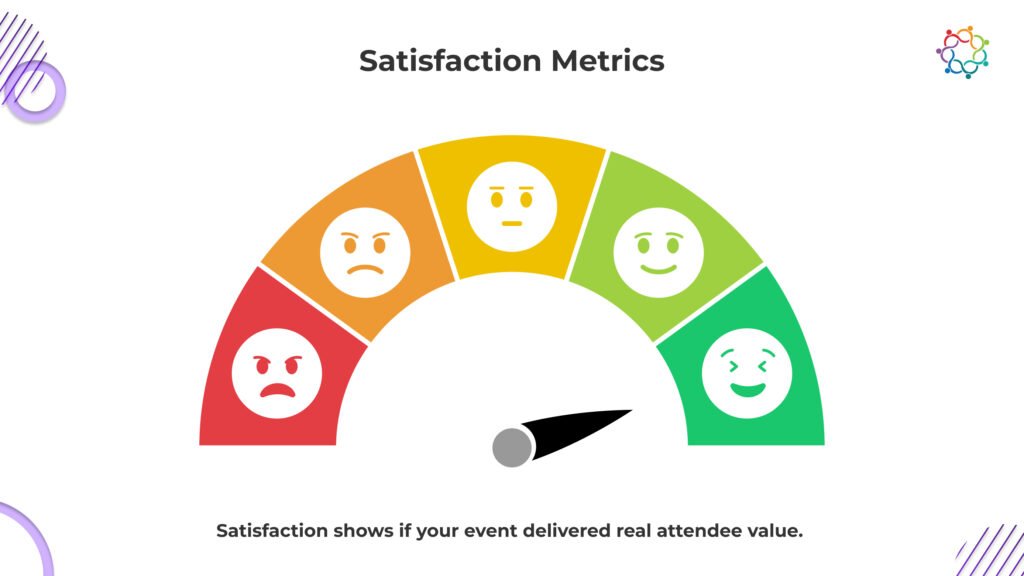
Events are not just numbers. Events are experiences. And satisfaction metrics show whether all those experiences cumulatively made attendees feel they got what they came for.
10. Net Promoter Score (NPS)
This common benchmark asks, “On a scale of 0-10, how likely are you to recommend this event?” It’s a simple and powerful question, a proxy for loyalty, and includes satisfaction overall.
11. Customer Satisfaction Score (CSAT)
CSAT digs a little further into the specifics. Asking the question, “How satisfied were you with the event overall?” is a direct measure of whether the attendee is happy with your event.
12. Post-Event Survey Ratings
Ask your attendees to account for their feedback by different areas: logistics, speakers, networking, and content relevance. This will uncover some specific strengths and weaknesses, giving you the opportunity to improve in a data-driven way.
All these metrics are valuable, for attendance, ask a question like “Was the event meaningful and worth it?”
Content Performance Metrics
For many organizations content is the value driver whether through thought leadership, product buy-in, education, or industry positioning. If you measure & understand your content’s performance, you can extend the life of the event.
13. Ratings for Speakers
You can see how individual speakers performed, who inspired attendees and who tanked. This is crucial for giving you tools for planning future agendas.
14. Reported Session Views (Live + On-Demand)
The live event is important, yet it also might be the on-demand views that provide some long-tail lift. When you have robust on-demand replay metrics, they tell a story of huge value for the ticket price (basically because they got you views) and they mean your event is providing an on-going value.
15. Social Engagement
Likes, shares, hashtag mentions and reposts provide information about how far your content travelled outside the event. They highlight a potential for amplification but should NOT be considered the measure of success.
These three have a follow-up: “Which themes of content-based engagement will remain?”
ROI Metrics
These are at the heart of enterprise conversations. While some of these metrics may come from the conversion portion of this post showing them explicitly clarifies things for the finance conversations.
- Revenue Generated – Closed deals specifically tied to the event.
- Cost Per Lead – New leads captured divided by spend.
- Event ROI % – (Revenue – Cost) ÷ Cost × 100.
These are numbers in addition to financial numbers; they are the numbers that build credibility. Human Resources, Customer Experience, and Engagement Representatives know how credibility feels in short supply. Demonstrating clear ROI from an event lets your executives see an event is a strategic investment, not just a cost centre.
Qualitative Insights to Include
While data will tell a story, we still crave context, which is why all post event reports do a decent job of also providing qualitative insights in addition to numbers.
- Open-Text Feedback – When attendees provide open-text feedback in survey results, this can be a great opportunity to receive a very candid, detailed, and even emotional expression of what worked and what did not.
- Social Sentiment – Attending “buzz” or positive or negative commentary related to hashtags is an on-the-ground measure of student enthusiasm even if it does not measure engagement on the event platform.
- Internal Team Debriefs – Sales, marketing, and operations people often have a different context and set of experiences, perspectives, and insights.
- Qualitative insights help create the “why” that relates to the data. Including this type of insight helps help contextualize reports and is invaluable for capturing massive nuance, instead of just sums or totals.
Samaaro Spotlight – One Dashboard for All Metrics
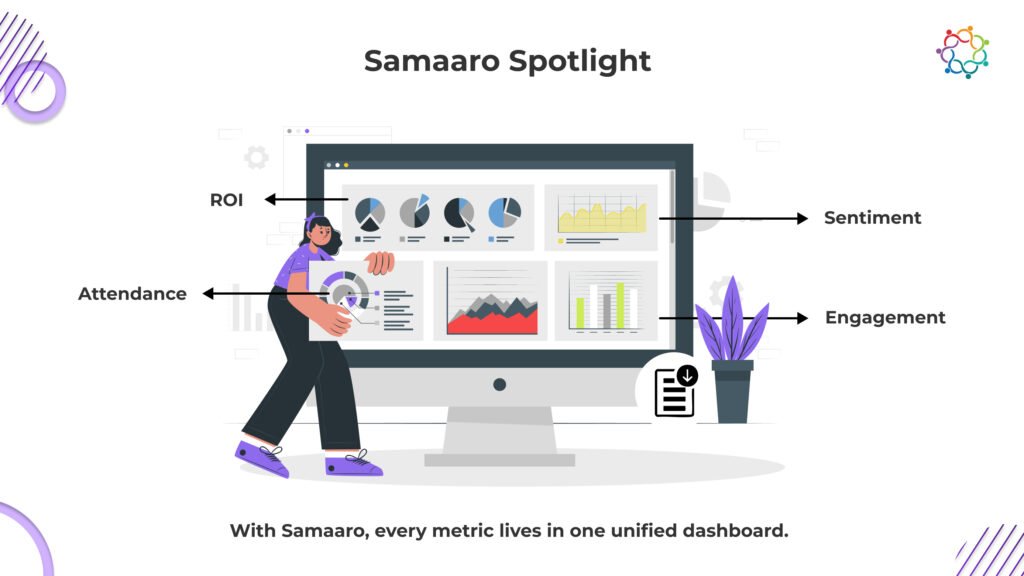
Most enterprise teams are problematic in that data are often Siloed, and Siloed engagement will not create a proper report because metrics could be whole disparate datasets. In this example, attendance could come from one platform, surveys from another, pipeline from a CRM, social analytics from yet another.
Samaaro has cracked the code with a full-service reporting suite that pulls your data all in one place, and is enterprise ready:
- KPI includes – All 15 relevant metrics are tracked and viewable on one dashboard.
- CRM Integration – Direct connection to all your CRMs (Salesforce, HubSpot, etc.) to (CRM) engagement with event activity.
- Automated Reports – Are available immediately in executive ready formatted reports, in hours not days, and drastically less time in producing reports manually.
Samaaro provides you with a solution to automate reporting so that it is not an administrative exercise, but a task to tell the story of impact.
Focus on Metrics That Move the Needle
Given today’s circumstances of having more data than at any other point in human history, it is important to focus on the unique, distinct set of metrics features and improvements, to provide clarity. By bilocating to the 15 post event metrics, enterprise teams could produce a report that:
- Mechanically shows pipeline and revenue impacts
- Includes both engagement and satisfaction metrics
- Collects purposeful value of engagement with content outside of the event
- Provides learnings to improve going forward
The best event teams understand that the report is not just about the numbers, but also about the narratives and stories it tells. When the correct metrics are selected intentionally and delivered strategically, it enables them to measure success while influencing the next answer to success.
Have a desire to streamline KPI tracking? Download our white paper on Post-Event Evaluation for more, or check-up Samaaro’s reporting process.
Frequently Asked Questions
1. What are the key attendance and reach metrics that every post-event report should include, and what do they collectively reveal?
The key attendance and reach metrics every post-event report should include are: total registrations, attendance rate, no-show rate, walk-ins, and social media reach. Together they reveal whether your promotion worked (registrations), whether your audience saw enough value to show up (attendance rate), and how much broader awareness the event generated. Strong attendance with low engagement signals a marketing-product mismatch. Weak attendance signals a positioning or audience problem.
2. How do engagement metrics like session attendance, poll responses, and Q&A activity indicate whether attendees were actively participating or passively present?
Engagement metrics like session attendance, poll responses, and Q&A activity tell you whether attendees showed up in body but checked out in mind. High session attendance with low poll response means people are there but not invested. High Q&A activity means content struck a nerve. App engagement scores combine these signals into one number per attendee, which makes it easy to identify your top 20 percent of high-intent attendees for sales follow-up.
3. What is the difference between leads generated, deals influenced, and pipeline attribution, and why are all three essential conversion metrics for enterprise events?
Leads generated counts how many qualified contacts came out of the event. Deals influenced counts how many existing pipeline opportunities had at least one event touchpoint. Pipeline attribution puts a dollar value on the deals event marketing contributed to. All three matter because leads alone undersell event impact (a single deal influenced can be worth 100 leads), and pipeline attribution is the language CFOs speak. Track all three and the ROI conversation becomes straightforward.
4. How do NPS, CSAT, and post-event survey ratings work together to measure overall attendee satisfaction?
NPS, CSAT, and post-event survey ratings measure attendee satisfaction at different depths. NPS tracks loyalty and likelihood to recommend. CSAT measures satisfaction with specific elements (sessions, food, networking). Open-text survey responses surface specific themes. Together they answer three questions: did attendees like it, what specifically worked, and would they come back. Each one in isolation tells half the story.
5. Why should content performance metrics like speaker ratings, on-demand session views, and social engagement be tracked in post-event reports?
Content performance metrics matter because they tell you which sessions, speakers, and topics earned attention, and which to repeat or retire next time. On-demand session views show what was valuable enough that people came back for it post-event. Speaker ratings highlight who to invite back and who to swap. Social engagement around specific quotes or moments shows which content traveled organically. This data shapes next year’s agenda decisions.
6. How is event ROI calculated, and what three financial metrics — revenue generated, cost per lead, and ROI percentage — help demonstrate an event’s business impact to executives?
Calculate event ROI as (revenue attributed minus total cost) divided by total cost, expressed as a percentage. The three financial metrics that demonstrate business impact to executives are: revenue generated (closed deals tied to event touchpoints), cost per qualified lead (event cost divided by SQLs), and ROI percentage. The first proves the event drove revenue. The second proves it was efficient. The third puts both in a number executives compare across marketing channels.
7. What are vanity metrics, and why should they be avoided in executive-facing post-event reports?
Vanity metrics like social likes or raw registrations look impressive but do not connect to business outcomes. Executives want pipeline, conversions, and ROI, so lead with metrics that prove impact.
8. What’s the difference between walk-ins and pre-registered attendance, and why does that distinction matter?
Pre-registered attendance shows how well your marketing worked. Walk-ins reflect onsite demand and brand pull. Separating them improves attendance forecasting, no-show planning, and channel performance analysis.
9. What benchmarks should organizations use to judge whether their attendance rate or NPS score is actually “good”?
Compare against your own past events first, then industry norms. Free B2B events often see 40 to 60 percent attendance. An NPS above 30 is solid, above 50 is excellent.
10. Which of the 15 metrics matter most for a small internal event versus a large enterprise conference?
Small internal events should focus on attendance rate, participation, and satisfaction scores. Large enterprise conferences need pipeline attribution, deals influenced, cost per lead, and ROI metrics.
11. How should teams balance short-term metrics (like registrations) against long-term metrics (like on-demand views and deals influenced) in a report?
Report both in separate sections. Short-term metrics like registrations show immediate reach, while on-demand views and deals influenced prove lasting value. Together they give leadership the full picture.