


The Hidden Depth of Event Data
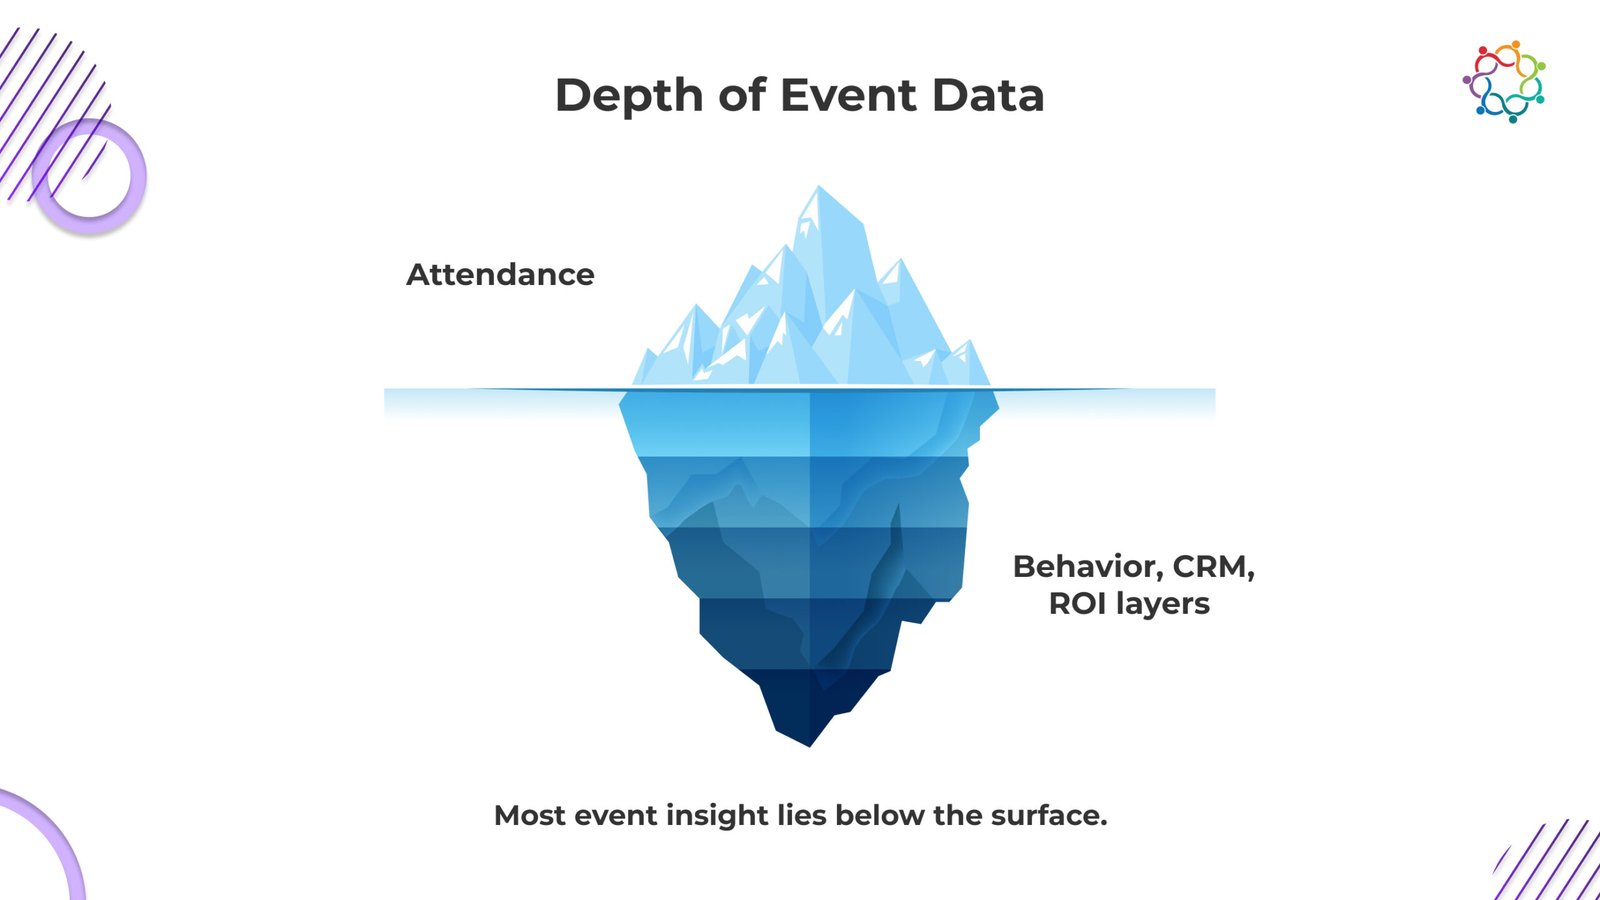
Event data has evolved into one of the most valuable strategic assets for modern marketing teams. Yet many organisations still view it through a narrow lens, focusing only on surface-level indicators such as attendance or registrations. In reality, every click, dwell, check-in, or content interaction reveals intent, readiness, and the true quality of audience engagement. When analysed as a unified system instead of isolated data points, these signals form a powerful intelligence model that can shape content strategy, optimise resource allocation, and directly influence pipeline outcomes. This blog explores the five layers of event data and how each contributes to enterprise decision-making.
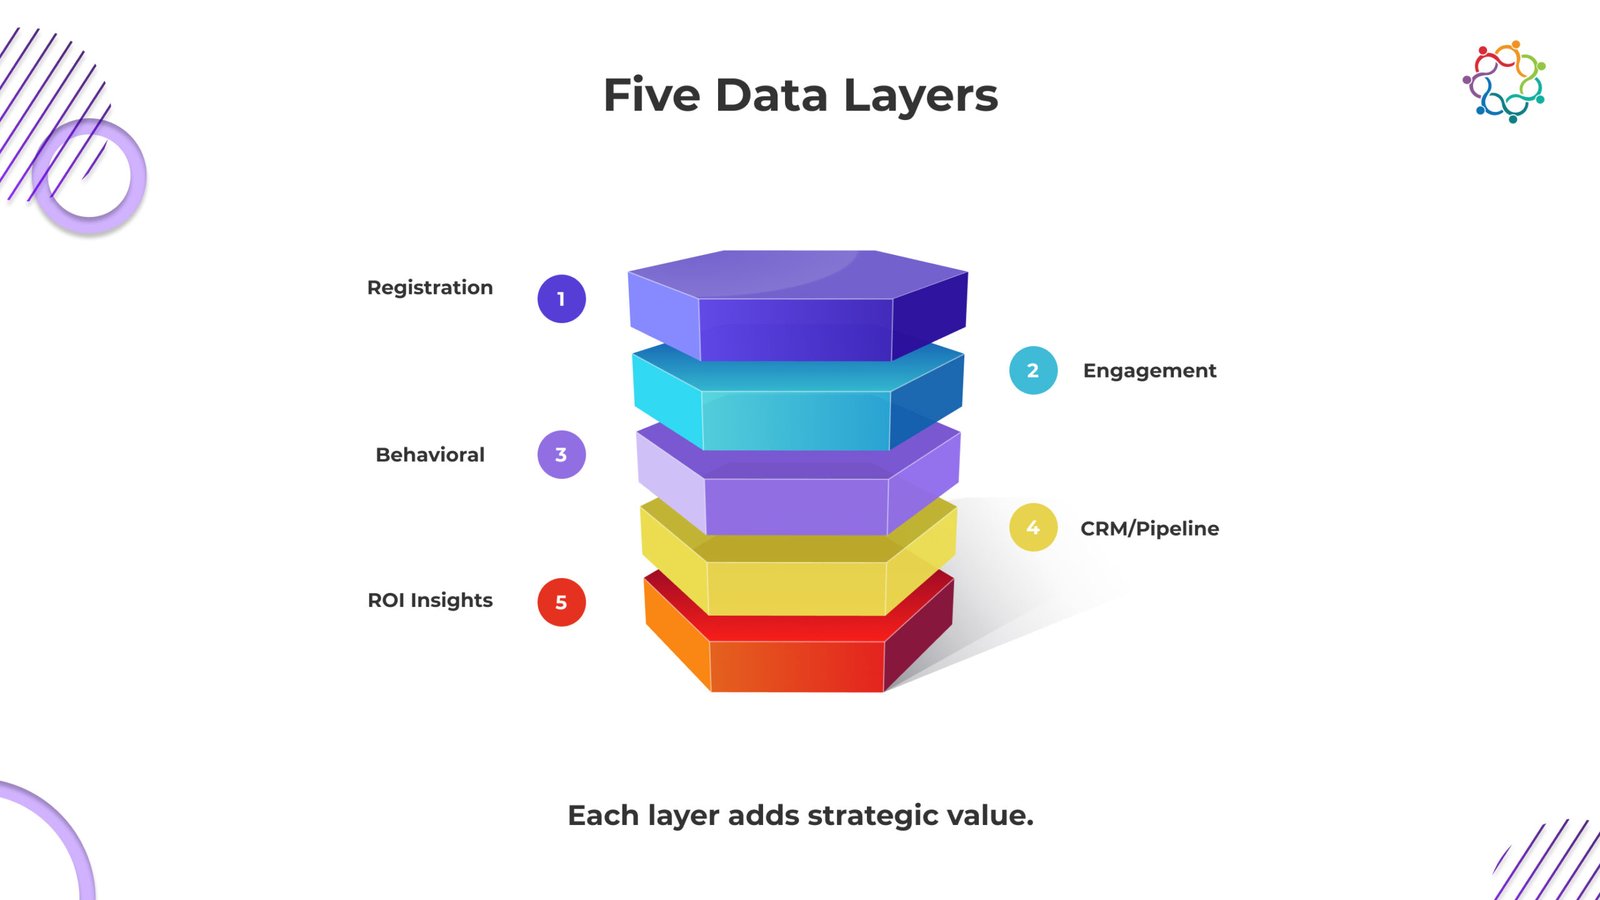
Layer 1 – Registration Data
The first layer of event intelligence starts long before your event begins. Registrant data reveals audience intent, discovery channels, and potential for segmentation. As a marketer, you are identifying which campaigns brought in the most registrations, which industries are the most interested in your event, and which regions are generating the most early engagement. The speed at which registrants are adding their names also reveals some insight into how your audiences behave, so you can understand if they are exhibiting the behaviors of planners, last-minute decision-makers, or both.
This layer shapes strategic decisions regarding messaging, outreach, and resource allocation. If you notice a high percentage of registrants are coming from a specific sector, the content of the sessions can be modified to reflect the registrants. Likewise, if there are geographic areas that are lagging behind in registrations, campaigns can be initiated in those regions to drive registrants. Registration data is relatively basic at first glance, but is foundational to forecasting demand, prioritizing the audience, and strategizing for the event in its early stages.
Layer 2 – Engagement Data
Once participants enter the event environment, engagement data is the next critical indicator of value offered. Engagement informs us where participants went, and how they engaged. This may include session join rates, poll answers, questions and answers, booth attendance, networking engagement, content downloads, etc. The aim of engagement data is to evaluate how well value was offered, and what sessions or activities provided that value.
Engagement data can also give insight into periods of the event that had the highest energy levels, and the topics that highlighted the most alignment with attendee interests. For example, if a session had low engagement, but high registration, this may indicate a timing issue. Or, if a workshop had high dwell time, and a second engagement, this may indicate a good content-community fit. Engagement data will also allow you to evaluate the speaker’s performance as well as the efficiency of the event format and content relevancy; however, engagement data will always be a primary action if you are committed to investing in optimising your event, long-term.
Layer 3 – Behavioral Data
Behavioral data extends beyond direct engagement actions and uncovers the “why” behind attendee movement and attention patterns. It tracks elements such as page views, dwell time in different event areas, navigational flow, mobile app usage, and repeated visits to certain zones or links. This type of data provides deep qualitative insight into intent.
For example, an attendee repeatedly viewing a product page or revisiting a specific session recording signals interest and potential readiness for a sales conversation. Long dwell time at knowledge hubs or exhibitor sections may indicate a need for more personalised content follow-up. Behavioral data gives marketers a richer narrative about what the attendee actually cares about, enabling highly targeted post-event communication, refined content strategies, and more precise audience segmentation.
Layer 4 – CRM & Pipeline Data
While behavioral and engagement data indicate intent, CRM and pipeline data connect that intent to business outcomes. This is the point where event intelligence (like an exit questionnaire) begins to be tied to revenue. Connecting event analytics to CRM visibility allows teams to see which breakout sessions led to booked meetings, which attendee actions helped accelerate the deal, and which sessions moved the pipeline.
This is especially important for CMOs and revenue leaders. It is clear after an event whether they succeeded in attracting their intended audience, whether engagement led into sales conversations, and where marketing and sales alignment need adjustments. When event data is linked to a CRM, the team no longer relies on subjective feedback after the event, instead uses solid proof to assess whether the event had an impact. The team is also equipped to see which cohort they truly value, how to nurture that cohort more strategically, and measure the actual impact of each event in growing the business.
Layer 5 – ROI & Strategic Insights
In the final phase, you’ll translate raw data into macro-level intelligence that will support your organisation to improve long-term event strategy. ROI and strategic insight are made up of the costs of engagement, pipeline contribution, audience retention and brand lift to support a true retrospective view of an event’s overall impact. Rather than to simply look at singular parameters such as attendance, this phase will support evaluating which format, topics or engagement led to a higher return on investment.
This level of event intelligence supports leaders to make better informed decisions around budgets allocation, prioritisation of channels and event design. For example, if data shows that thought-leadership sessions positively influence pipeline better than product demos consistently, teams can focus their attention for the next event in a similar way. Similarly, retention insight suggests how the event performed in influencing community building or loyalty. Strategic intelligence takes us from the tactical execution of event marketing to upon enterprise plan for growth.
Samaaro Spotlight – Turning the Five Layers Into One Intelligence Engine
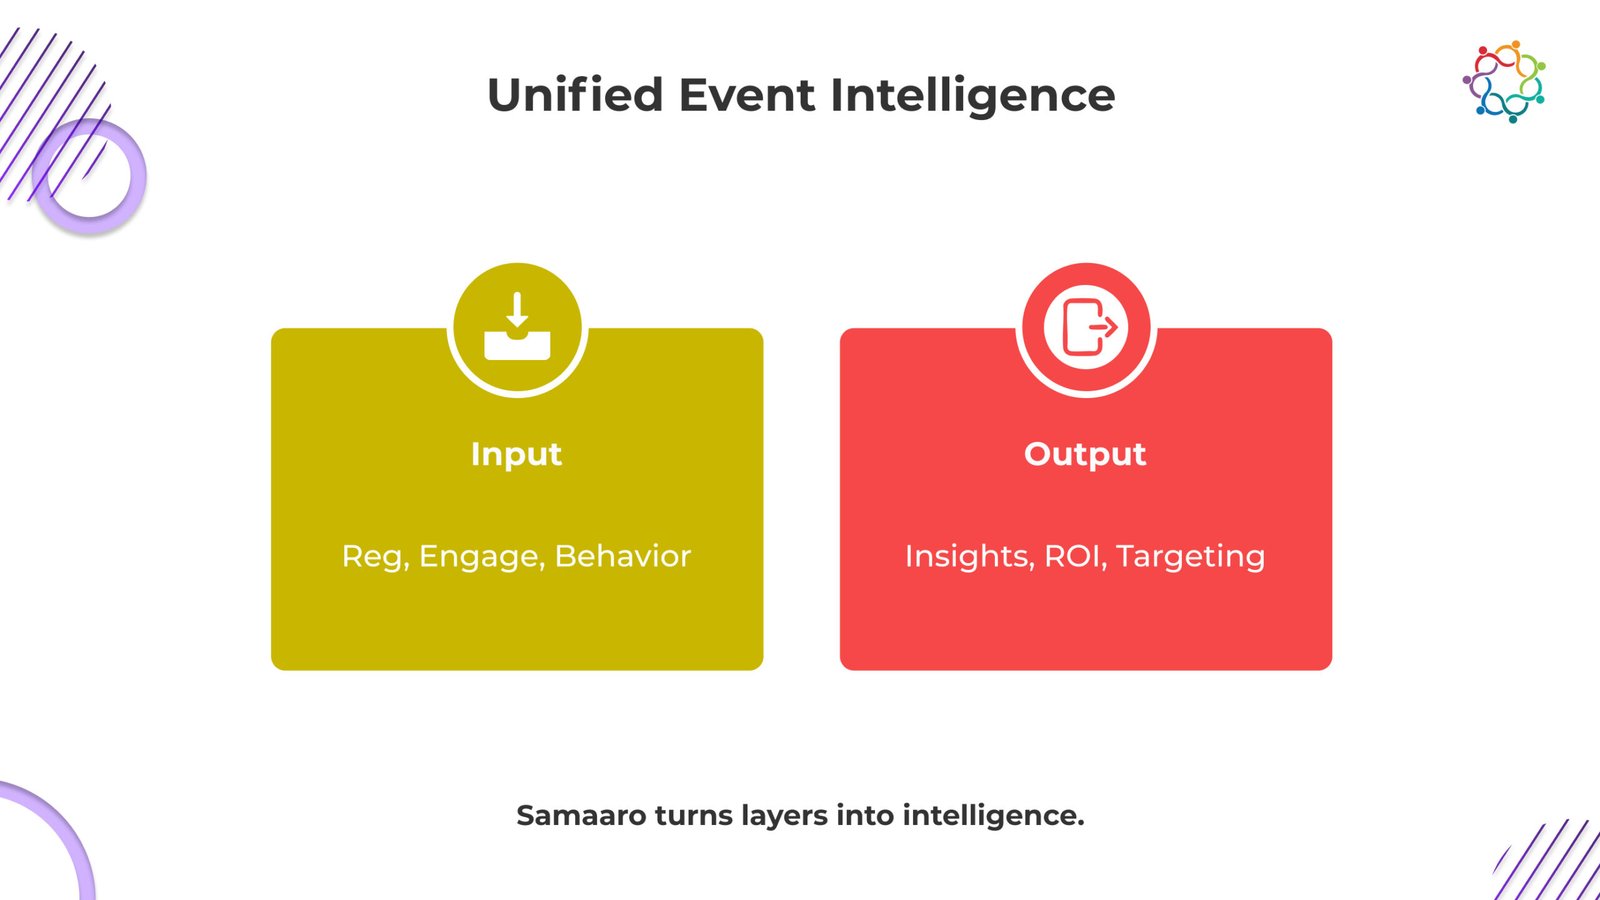
Most organisations handle registration data in one tool, engagement analytics in another, behavioural signals in a third, and CRM outcomes in a fourth. Samaaro removes that fragmentation by unifying all five layers of event data into a single analytics engine designed for enterprise decision-making.
1. Registration Intelligence
Samaaro captures acquisition channels, sector mix, regional distribution, and signup velocity, then connects these patterns to actual behaviour and pipeline outcomes. This turns registration data from a vanity metric into an early predictor of demand and audience quality.
2. Engagement Analytics
Session join rates, poll responses, engagement hotspots, and content downloads flow into a real-time dashboard. Samaaro highlights what delivered value and what underperformed, giving teams immediate clarity on content relevance and speaker impact.
3. Behavioral Signals
Heatmaps, dwell time, navigation flow, repeat visits, and mobile usage patterns are merged with engagement data to reveal intent, not just participation. Samaaro shows who is exploring deeply, who is circling high-value content, and who is signalling readiness for a sales conversation.
4. CRM & Pipeline Alignment
Samaaro connects every interaction to CRM records to surface account-level impact: which sessions accelerated deals, which content triggered meetings, and which behaviours correlate with pipeline movement. This creates a verifiable bridge between marketing activity and revenue outcomes.
5. ROI & Strategic Intelligence
The platform consolidates depth, influence, sentiment, and pipeline contribution into a single ROI layer. Leaders can see which formats produce the highest ROI, which audiences convert, which topics create momentum, and which events deserve future investment.
Instead of isolated metrics, Samaaro produces a connected narrative, from the first registration signal to the last pipeline movement. This gives enterprises the ability to design sharper events, predict behaviour, and allocate budgets based on evidence, not instinct.
Samaaro transforms event data from scattered numbers into a unified intelligence system built for enterprise growth.
Every Click Tells a Story
Event data is more intricate and significant than most organisations might think. Users’ interactions, when connected, represent a fuller picture of who your audience is, what is important to them, and how they view your event or event experience as part of a larger business result. Every click, tap or interaction contributes to a cohesive narrative that provides teams with the insights to make more informed decisions and to create purposefully curated event experiences that are valuable, interesting, and engaging. As in many cases the enterprise ecosystem supports a movement to predictive event strategy, adding integrated event intelligence to try insights well not only support this evolution but is essential to modern experience design and event success.
Unlock 360° event data intelligence with Samaaro.
Frequently Asked Questions
1. What tools or systems are typically needed to capture behavioral data like dwell time and navigation flow at an event?
Event apps, QR or badge scans, platform analytics, and Wi-Fi or beacon tracking capture behavioral data like dwell time, navigation flow, and repeat visits across your event.
2. What’s the difference between engagement data and behavioral data if both track attendee activity?
Engagement data measures active participation like polls answered and questions asked. Behavioral data tracks passive patterns like page views, dwell time, and navigation paths attendees may not even notice.
3. What privacy or consent considerations apply when tracking detailed behavioral data like page views and repeat visits?
Collect clear consent at registration, explain what gets tracked, anonymize data where possible, and follow GDPR and local privacy laws. Transparency protects both attendees and your organization.
4. What skills or team roles are needed to properly analyze and act on data across all five layers?
You need a marketing ops or event analyst to interpret data, a CRM admin to manage pipeline connections, and leadership involvement to turn insights into decisions.
5. What’s the best way to present multi-layered event data to executives who only care about bottom-line ROI?
Lead with ROI and pipeline numbers on a single dashboard. Show briefly how each data layer feeds revenue, then keep supporting detail available for anyone who asks.