

Did your last event truly succeed, or just have an awesome turnout? This is an important question to think about in our age of event marketing and branding, when tangible results are more important than ever. Days of specifically measuring attendance and showcasing impressive head counts will be over, at least if we want to deliver meaningful results. While total attendance might look good on paper, unless we dive into the metrics of our event, like engagement levels, content values and leads based on quality, we are only getting a small fraction of the event performance data.
The competition in the digital landscape continues to grow, and measuring impact without precision has never felt more needed. We can move away from headcounts and begin using meaningful event analytics to help us generate our own insights. This guide will help illuminate what you should consider as success for events in a data-driven environment and bring clarity to the multitude of numbers that matter. More importantly, you will learn how to make sense of those numbers in relation to each other, and to your event, so you can use your new insights to inform your next event.
The New Frontier of Event Metrics: What Truly Matters
Counting registrations of attendees or social media likes as indicators of success is a thing of the past. The “new world” of event metrics creates a must-change environment where we will define success from “vanity metrics” less and from truly actionable metrics that inform strategy, and provide outcomes based on business results.
Anytime someone tells you they had a “large registration count” is great to hear but does not tell you if your attendees felt valued, if the speaker kept the audience engaged, if your content meant something, and if your sponsors met their goals or delivered on those goals. To understand your event’s overall and true performance means to categorize, segment and evaluate the data across several core dimensions.
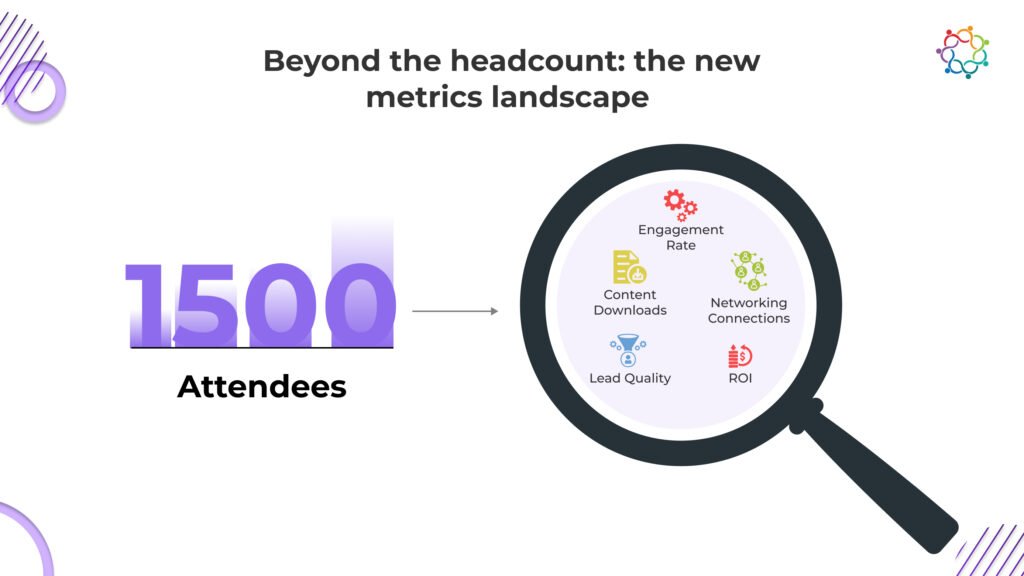
To gain a holistic and meaningful view of your event’s performance, it’s essential to categorize and dissect your data across several crucial dimensions:
- Engagement: Engagement goes beyond someone’s login or attendance into the behavior of participation. Engagement behavior includes duration of session (time the attendee was actively engaged in a session), chat activity, shared resource clicks, response to polling, and time spent actively exploring booths or a particular area of the physical event.
- Content: The content is often the main product of many events. Certainly measuring content effectiveness requires both reach and resonance. Two metrics that tell us about effectiveness include session views (measuring both live and on demand consumed views, which communicate content’s durability) and downloads of a presentation or an exclusive guide. Attendee rating of quality and relevance of the content can help you again pay attention to your most relevant and effective topics and speakers.
- Networking: Networking is a primary motivator for many attendees. To measure success with networking, think about the quality and the quantity of connections made. You may want to track the number of scheduled 1:1 meetings and then measure the actual, completed meetings; the number of booth visits, and the number and the type of messages exchanged between attendees and exhibitors.
- Lead/Business Impact: Finally, and importantly, what contribution did your event make to your larger business goals? Here is where you can measure the impact to your bottom line. Ensure you are tracking MQLs (Marketing Qualified Leads), attributing pipeline growth to your event interactions, and identifying specific signage triggers that directly came from the event. Lead/ business impact will provide you the clearest view into your event ROI.
Decoding Engagement Metrics: Beyond the Login
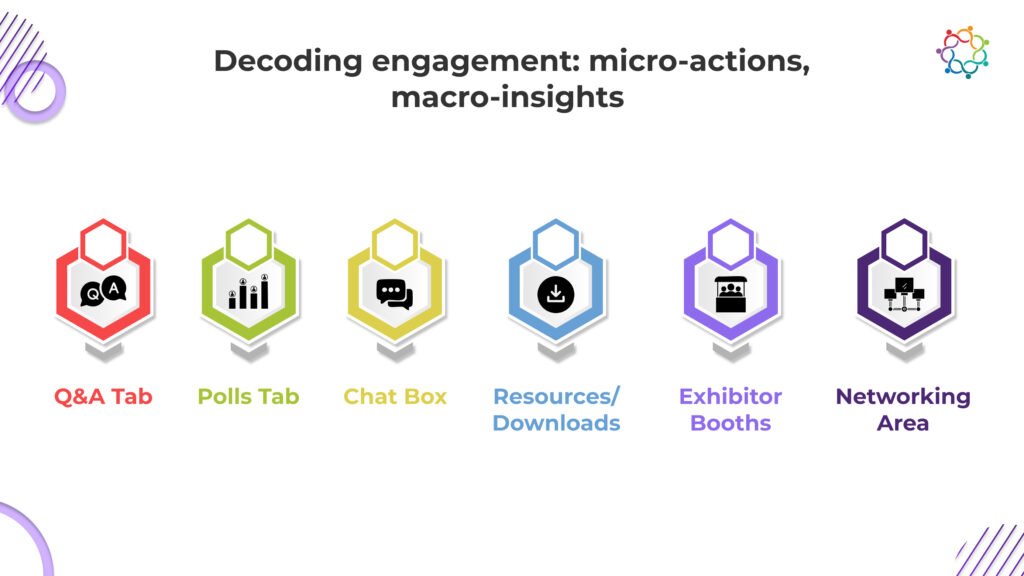
When it comes to events, knowing what sessions attendees have participated in before is essential. Simply logging in is no longer enough; you want to understand the level of engagement and quality of the experience. Exploring the data on attendee behaviour is central to understanding and improving the event experience.
- Session Completion Rates: This is an incredibly meaningful measure of the stickiness of your content. Tracking how many attendees not only log in but will remain in a session until the session is finished can inform you on what topics and styles of presentations are attracting and/or engaging most attendees.
- Time Spent in Platform/Booths: A general indicator of overall interest and immersion in your event environment. If attendees are spending significant time navigating the platform, exploring different areas, and engaging with various elements, it suggests a high level of satisfaction and perceived value.
- Interaction Rates: The hallmark of an engaged audience is a level of participation. You can check the number and quality of questions in your live Q&A and the percent of your audience who took part in polls and the intensity of messaging in chat feeds, to know right away how the audience is responding.
- Micro-conversions: These are smaller, but significant, behaviours that may indicate a larger conversion is taking place. Examples may include a resource view (e.g. downloading a PDF, seeing a short explainer video embedded in the booth), or profile views in a networking area.
To collect this data accurately, you must have solid analytics tools. The native analytics dashboard of your event platform should be your first stop for comprehensive data about what has transpired in your event.
Measuring Content Effectiveness: What Resonates?
The content you present is often the core value proposition of your event. Effective event analytics allow you to ascertain if that content truly resonated with your audience and delivered on its promise.
- Content Downloads/Views: This is a great way to observe the value of the content, in a direct way. Tracking downloads or views of related resources is a clear indicator of what content attendees found valuable and what they might return to after the event ended if they had access to the content again.
- On-Demand Session Views vs. Live Attendance: This is an indicator of attendee preference and the continued relevance of your content. If there are large discrepancies where on demand sessions outnumber live attendance, this often means your session took place at an odd time or attendees enjoyed the flexibility of the on-demand option.
- Popularity of Specific Topics/Speakers: By reviewing session data, if the attendees liked the specific content offered, speakers, and viewership level over time, you will understand which subjects have the largest impact on attendees.
- Feedback Scores for Content Quality and Relevance: Direct attendee feedback, gathered through surveys or integrated rating systems within the platform, provides rich qualitative and quantitative insights.
Quantifying Networking and Lead Quality
Beyond learning, events are powerful catalysts for professional networking and a prime channel for lead generation. Utilizing precise event data to quantify these interactions is fundamental to demonstrating event ROI for both attendees and sponsors.
- Number of 1:1 Meetings Scheduled/Completed: A direct and measurable metric of proactive networking. An overall high completed meeting rate strongly indicates the connections that were made were relevant and meaningful to the attendees and add to their event experience.
- Exhibitor Booth Visits & Lead Capture Forms Completed: For sponsors/exhibitors, booth traffic is significant. The ability to effectively capture booth visits, engagement with the booth’s content and their most important number – the opportunities the sponsor is providing in leads captured via forms in the booth is rare data.
- Quality of Leads: It’s not just about the quantity of leads; quality is paramount. This can be assessed through qualification questions asked during registration, during booth interactions, or integrated into meeting scheduling.
- Post-Event Sales Pipeline Progression: This is truly the end all measure of business impact. Monitor which attendee segments converted to qualified leads, what proportion of leads entered your sales pipeline, and how long it took for those leads to work through the funnel, compared to leads gathered through other methods.
Actionable Insights: Turning Data into Your Next Event’s Superpower
Collecting vast amounts of event data is only the first step. The true power of event analytics lies in its transformation into actionable insights that drive continuous improvement and future event success. Think of this as a continuous improvement loop, an iterative process that makes each event smarter than the last:
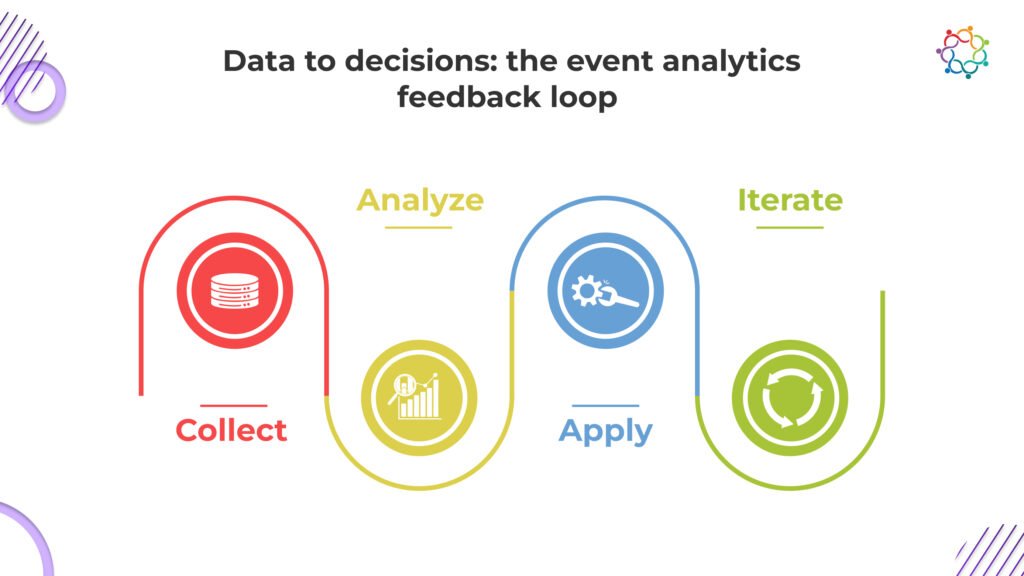
- Collect: In this first step, you bring together any relevant event data. This can include engagement metrics taken from your event platform, web analytics (Google Analytics), CRM data, survey responses and even mentions on social media.
- Analyse: After collecting, raw data must be decoded. Start to look for patterns, trends, outliers and correlations within your event performance data. Identify which sessions had unanticipated drop-off in attendance, which content was most consumed, which networking feature was most utilized, did any sponsors get qualified leads because of exhibiting in your event?
- Apply: Now, this is where the “work” happens, and insights turn into changes. Use your analyses to inform the way you design upcoming agendas and session formats, double down on what works and improve what didn’t. After identifying the topics and presenters that continually resonate, inform the next speaker selection.
- Iterate: Even paid advertising is not a “set it and forget it. Events aren’t either. Implement the changes and optimizations from your analyses, and in turn track their impact on your next event. Continuous, iterative improvements from the events analytics will be the key to long term event success and will ensure that each event becomes a lesson and in turn helps support the planning of the next event.
How Samaaro Empowers Your Data-Driven Event Strategy
Samaaro is more than just an event platform; it’s a comprehensive partner in decoding event analytics. Our robust platform provides all the event performance data you need and the intuitive tools to transform raw numbers into strategic advantages for your brand.
- Samaaro’s Native Analytics Dashboard: Offers a centralized, intuitive, and real-time view of all your crucial event metrics. This dashboard gives you immediate access to performance data, from overall attendance to granular interactions within sessions and booths.
- Customizable Reports for Post-Event Reporting: Generate tailored reports that provide deep dives into specific areas of interest. Whether you need a comprehensive overview of attendee engagement metrics, a detailed breakdown of sponsor interactions, or a precise calculation of event ROI, our reports can be configured to meet your exact needs.
- Integration Capabilities (CRM, Marketing Automation): Samaaro seamlessly connects your event data with your existing CRM and marketing automation systems. This ensures a holistic view of your customer journey and allows for accurate event ROI attribution. You can, for instance, track real-time booth visits and export qualified leads directly into your CRM for immediate sales follow-up.
- Smart Segmentation for Targeted Action: Use post-event engagement scores to build smarter retargeting lists. Samaaro helps you segment attendees based on their behaviour, enabling highly personalized follow-up campaigns that convert.
- Interpreting Attendee Behaviour Data: Samaaro helps you understand not just what happened, but why it happened. Our tools provide the necessary context to interpret attendee behaviour, leading to truly data-driven decisions that optimize every facet of your event strategy.
The Future of Events is Data-Powered
In the evolving landscape of corporate and community gatherings, relying solely on surface-level metrics is a relic of the past. While most events might look successful on paper based purely on headcount, the question remains: are they truly effective in achieving their deeper objectives?
Embracing a data-driven event planning approach means understanding the intricate web of attendee engagement metrics, pinpointing true event ROI, and making informed decisions that continuously refine and elevate your offerings. Samaaro equips you with the advanced analytics tools to decode every layer of your event’s performance, allowing you to turn raw data into strategic action.
Ready to unlock the full potential of your event data? Discover how Samaaro’s advanced analytics can help your next event drive real results.
Frequently Asked Questions
1. What’s the difference between a vanity metric and an actionable metric in event analytics?
A vanity metric looks good but does not guide decisions, like raw registrations. An actionable metric, like session conversion rate, directly tells you what to change next.
2. What’s the best way to define “quality” leads through registration or booth qualification questions?
Add qualifying questions to registration and booth forms: role, company size, buying timeline, and budget. Score responses against your ideal customer profile to separate quality leads from browsers.
3. What role does Google Analytics or web analytics play alongside an event platform’s native dashboard?
Web analytics like Google Analytics tracks traffic sources and pre-event page behavior. Your event platform dashboard covers in-event engagement. Together they reveal the complete attendee journey.
4. How can event teams avoid analysis paralysis when faced with too many available metrics across all four dimensions?
Choose a small set of metrics per goal and review only those. If a number does not drive a decision or action, drop it from your regular reporting.
5. What’s the difference between tracking micro-conversions and tracking macro conversions like MQLs?
Micro-conversions are small steps like content downloads or session joins. Macro conversions are business outcomes like MQLs and booked meetings. Micro-conversions predict and lead to macro results.