

Why Post-Event Evaluation Often Feels Overwhelming
If you ask any event marketer what they do following a successful conference, seminar, or customer workshop, you will typically receive the same answer: reporting. But the reality is that post-event evaluation feels like an overwhelming task to many teams.
Why? The answer is straightforward: events generate enormous amounts of data – registration data, attendance figures, survey results, social media mentions, and revenue figures. Without a structured approach, reports quickly turn into documents heavy with data in PDF form, with nobody reading them, and the insights often not informing future strategies.
In fact, evaluation should not be about collating data. It should be about creating meaning out of that data and using those insights to create better vehicles for value in the next event. This is where having a clear and structured approach is invaluable.
In this blog, we provide a five-step framework for post-event evaluation. By implementing this framework, event marketers can create clarity out of confusion and use their evaluations as a continual improvement engine for their event portfolio.
Step 1 – Define Goals and KPIs
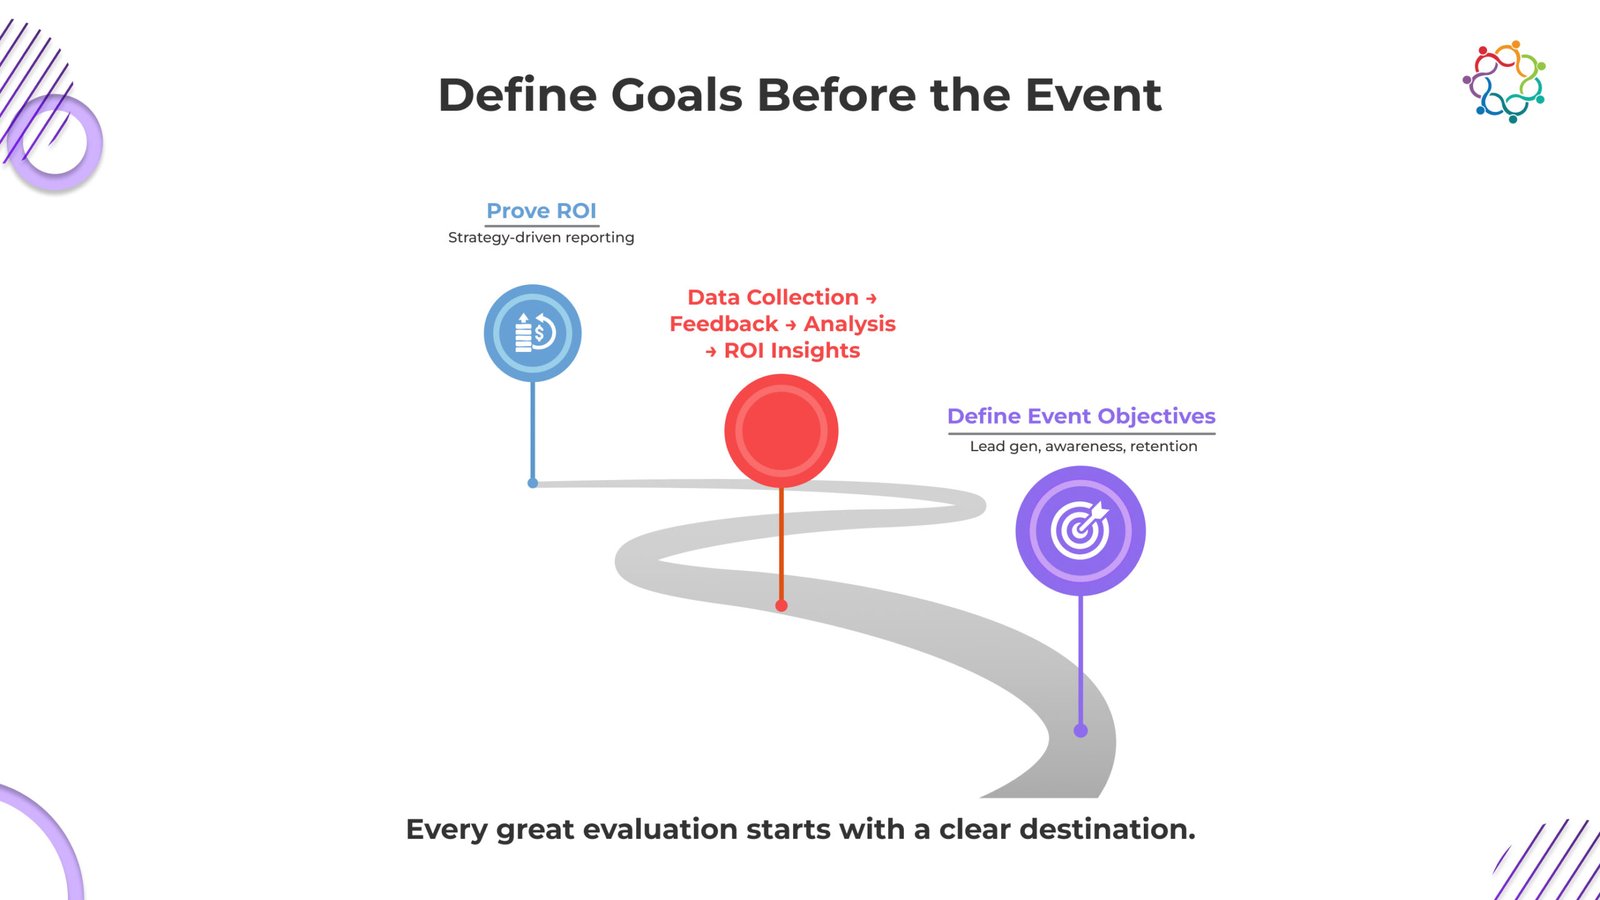
Good evaluation starts well before the event. Without solid goals, post-event reports will have little meaning and will often just serve as vanity metrics.
Think about it: what does success actually look like for this event? The answer will be dependent upon your business priorities.
here are some examples of different goals that are relative:
– If your goals were ROI-oriented: revenue, cost per lead, sponsor ROI
– If your goals were Engagement oriented: session attendance, responses to surveys, participation in live Q&A’s
– If your goals were brand: awareness lift, thought leadership visibility, media mentions
– If your goals were pipeline :leads generated, deals influenced, opportunities accelerated
From your goals you will create specific KPIs. For example, if your goal is demanding generation then your KPIs could be number of MQLs (marketing qualified leads), pipeline, and cost per lead.
The key is alignment. When your event goals and KPIs connect directly back to larger business goals, post-event reporting will be relevant to your decision makers instead of a collectible document that sits in a silo.
Step 2 – Collect Quantitative and Qualitative Data
Once the event has wrapped up, the next stage is collecting data – and this is when lots of teams over-focus on the numbers assigned to the work, and forget about all the human input involved. A quality evaluation includes both quantitative- and qualitative-based data.
Quantitative data includes:
- Registrations vs show up rate.
- Session attendance and drop-off rate.
- Email sent and open/click rates.
- NPS (Net Promoter Score) and CSAT (Customer Satisfaction Score).
- Revenue attribution and pipeline data.
Qualitative data includes:
- Open-text survey responses (“What did you enjoy most about the event?”)
- Social media sentiment and direct attendee comments.
- Reflections from your internal team (the performance of your speakers, your logistics, etc.)
- Testimonial or case study material from attendees.
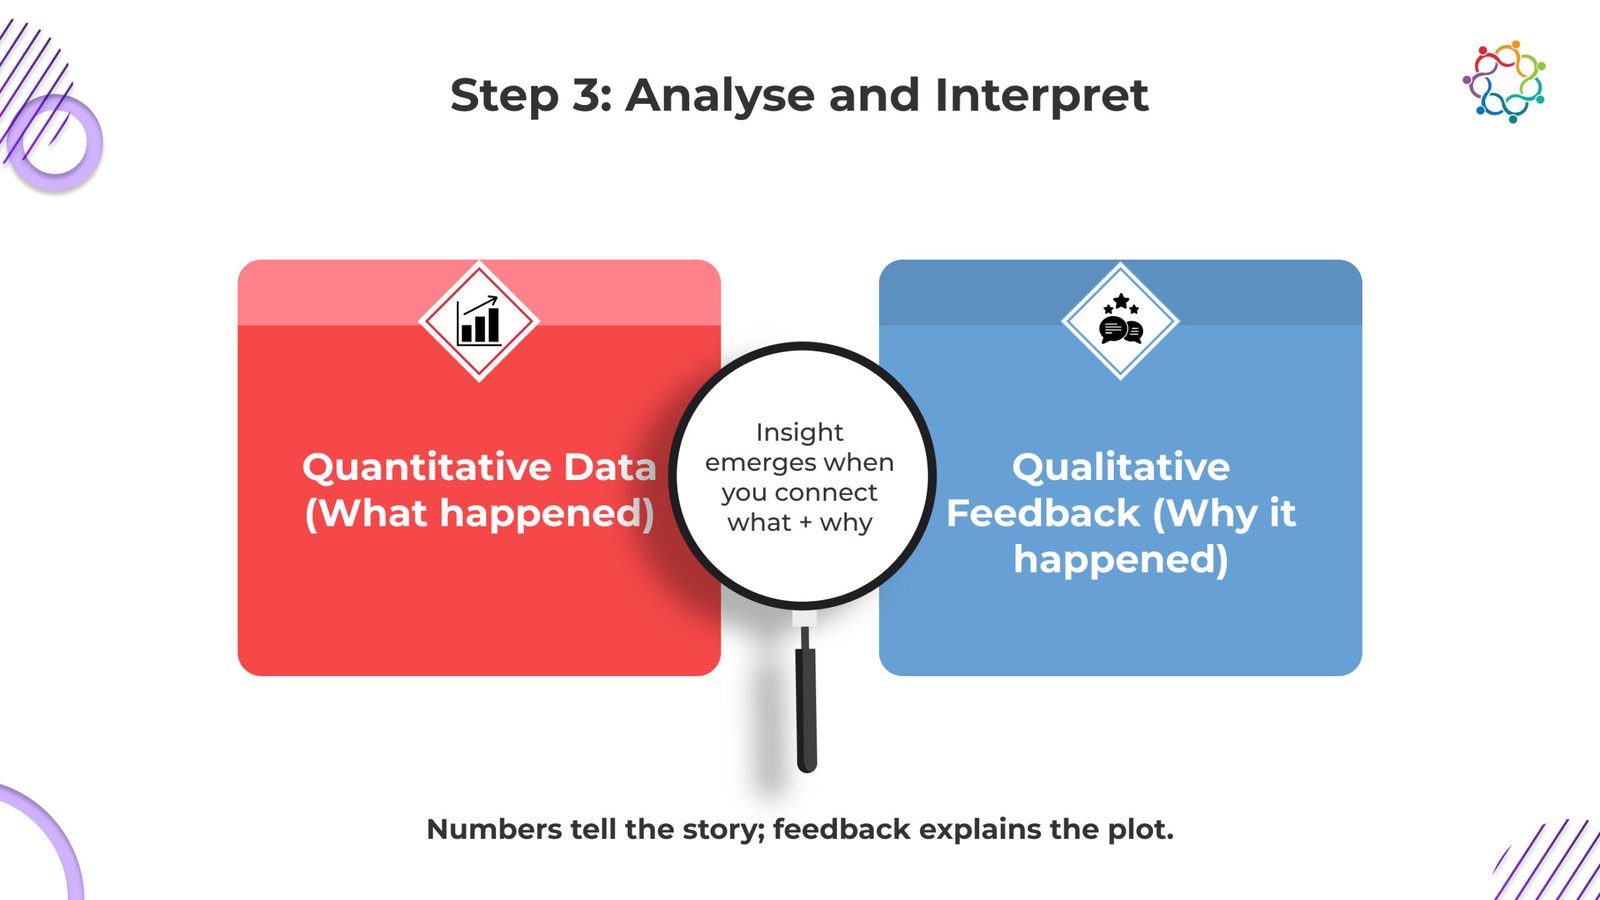
Why does this balance matter? Because quantitative data tells you what happened, qualitative feedback explains why it happened.
For example, your report may be showing that participants drop off in the afternoon sessions. Qualitative feedback will help you understand why: the schedule was too full or timing wasn’t good for international attendees. Without examining both perspectives, your insights will not be comprehensive.
Step 3 – Analyse and Interpret the Data
Data collection is only useful with the right analysis. This means you need to pinpoint your findings by recognizing trends, noting deviations from the norm, and connecting the findings to overall objectives.
- Find the trends:
Did some channels lead to more registrations than others consistently? Were some content items (panels or keynotes) higher in engagement?
- Identify the gaps:
Where were you failing? Did sponsors appear to be unhappy? Was there a lack of engagement from a certain geographic region?
- Account for the irregularities:
Is there a reason why one campaign performed poorly while another one was exceeding expectations? Did the timing, messaging, or targeting differ somehow?
Here’s an example: Let’s say in your report you noticed that the attendance at your event was lower than expected (60%). The report could easily end there but please take it a step further. You might go through feedback and discover that multiple registrants from the APAC region could not attend because the session times did not work with their work times . At least you now have that as a tangible improvement point for your next event.
Numbers are the “what” but the analysis of what happened, in conjunction with feedback is the “why” you are going to formulate strategy.
Step 4 – Structure the Report Into Actionable Sections
A solid post-event report is not just a data dump but a structured storytelling exercise, what digs into important details for each stakeholder. An operational structure might consist of:
- Event Overview: Event name, date, location/format and key objectives.
- Goals vs Outcomes: Compare intended goals to actual outcomes (e.g. goal of 500 registrations, resulted in an outcome of 620).
- Engagement Highlight Data: Session-level data, survey participation, social buzz.
- ROI Analysis: Revenue impact, cost per lead, sponsor ROI, impact on pipeline.
- Feedback Highlights: Key attendee quotes, key themes, qualitative feedback.
- Key Recommendations: Recommended actions moving forward for future campaigns.
The intention is to write a report that matters but is focused. Senior-level leadership and stakeholders do not need 30 pages of raw data. They need a sense of success, what worked, what didn’t work, and recommendations for next steps.
Using dashboards, infographics, and visuals can not only make for a more engaging report but provide an easier read for stakeholders.
Step 5 – Apply Insights to Future Strategy
One of the most common pitfalls teams fall into is acting only when the report has been delivered. The opportunities for learning from an event should not stop upon delivery of the report – we need to “feed” insights that generate learning into the next cycle of planning to affected future strategy.
Some examples of changes driven by insights are as follows:
- Budget Alignment: if LinkedIn ads drove 70% of qualified leads – allocate additional budget to that channel for the next phase
- Content Focus: if participants rated the panel discussions higher than the keynotes – show there is an appropriate seat by including more panels in the next agenda
- Geography: if an underwhelming amount of APAC respondents caused confusion in pre-post engagement because their live updates were out of their time-zone schedule – host the sessions at more inclusive times (including APAC participants time-zone in marketing)
- Process: if surveys indicate participants felt friction during registration – address friction in sign-up workflows
This step is making evaluation, remediation and planning into an ongoing cycle of evaluation. Therefore, improving each event beyond the last!
Mini Case Example – How One Team Used the 5 Steps
Think about a B2B SaaS company conducting their annual customer summit. They defined their goals as lead generation, customer retention, and positioning themselves as thought leaders in the community.
- Step 1: They established their target KPIs; 1,000 registrations, 300 SQLs (sales-qualified leads), NPS (net promoter score) above 50.
- Step 2: They collected their data (quantitative: attendance, deals influenced; qualitative: feedback on session relevance).
- Step 3: After analysing their data, they realized they achieved their lead generation goals, however sponsors reported lower levels of satisfaction because they could not network enough.
- Step 4: They produced a report that showed their successes (pipeline influenced by $8 crore), and where they struggled (sponsor ROI).
- Step 5: For their next summit they made the adjustment to create networking hours specifically for sponsors and tenants, which improved exhibitor renewals.
This framework allowed them to use their data and avoid a generic review of their summit and make a strategic plan to improve for both tenants and sponsors the following year.

Want to see how this would work for you?
Run all 5 steps in one platform
See how Samaaro automates the path from feedback collection to ROI insight, end to end.
Book a tailored walkthroughSamaaro Spotlight – Tools to Simplify the 5-Step Framework
Though the 5-step process seems like a manageable system, executing it manually is a significant time, energy, and resource drain. Samaaro provides a way to operationalize each stage of the 5-step process.
- Feedback Manager: Management of the qualitative data across all surveys, NPS, and testimonials.
- KPI Dashboards: KPI collection of registrations, pipeline, revenue, engaged attendees, etc. is organized into dashboards that the event team can reference throughout the event lifecycle.
- Report Automation: Visually appealing, data-rich reports that are export-ready for stakeholders aligned with the 5-step process.
- CRM System Integration: Direct connectivity of event performance measures to sales pipeline and ROI.
By allowing event teams to collect data, analyse results and develop reports in one place, Samaaro is focused on highlighting ways to pivot from simply gathering information to strategically applying that which was learned through the process.
From Evaluation to Evolution
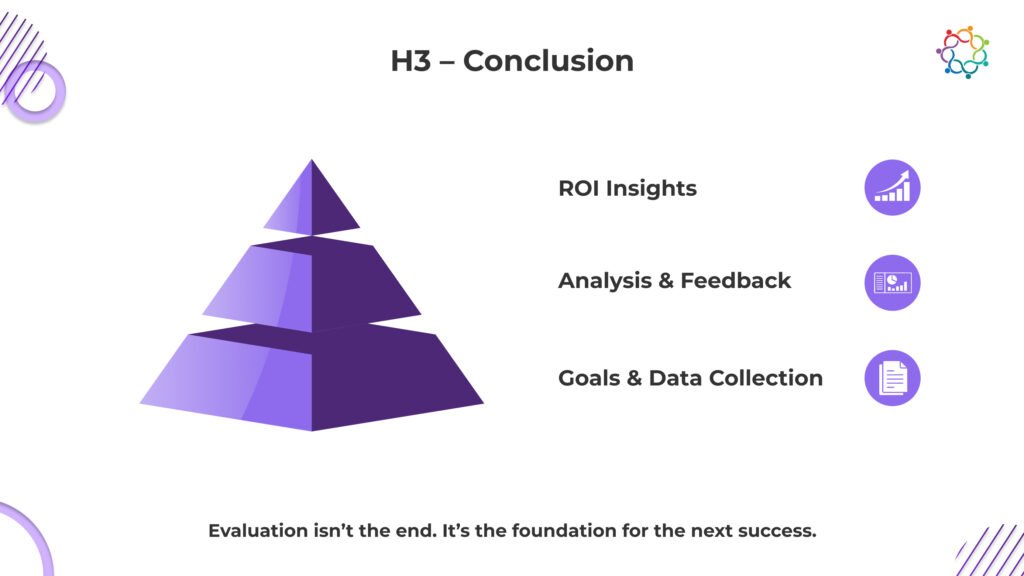
Post-event evaluation doesn’t only concern the past, it helps to define the future. Time after time, teams become consumed by a sea of numbers and fail to ask the important questions: What do these learnings mean, and how can they support betterment?
When marketers suss out the evaluation process into 5 parts, establish objectives, gather data, finalize learnings, prepare reports, and utilize recommendations, then reporting is an after-thought, not an after-event report.
Structured evaluation ensures that each event is smarter, more efficient, and more effective than the last. And with development tools like Samaaro, taking feedback and rendering ROI insights is not just possible but easy.
Would you like an ‘off-the-shelf’ evaluation model? Download our Post-Event Evaluation white paper or analysis how Samaaro is moving event organizers from feedback to ROI insights.
Frequently Asked Questions
1. How soon after an event should the post-event evaluation process begin?
Start immediately. Send feedback surveys within 24 to 48 hours while memories are fresh, then complete analysis and reporting within two weeks of the event.
2. What is the difference between vanity metrics and meaningful event KPIs?
Vanity metrics like raw registrations look impressive but prove little. Meaningful KPIs, such as qualified leads, pipeline created, and conversion rates, connect the event directly to business goals.
3. How should event ROI be calculated when revenue impact isn’t immediately visible?
Track leading indicators first: pipeline created, meetings booked, and engagement scores. Then revisit attribution after your typical sales cycle completes, when event-influenced deals have had time to close.
4. What is the ideal length and format for a post-event report shared with senior leadership?
Keep it to one or two pages or a short dashboard: goals versus outcomes, key wins, ROI summary, and clear recommendations. Leadership wants decisions, not raw data dumps.
5. What common mistakes cause post-event insights to go unused in future planning?
Insights go unused when nobody owns them, deadlines are missing, findings hide in long decks, and teams skip reviewing past learnings before planning the next event.